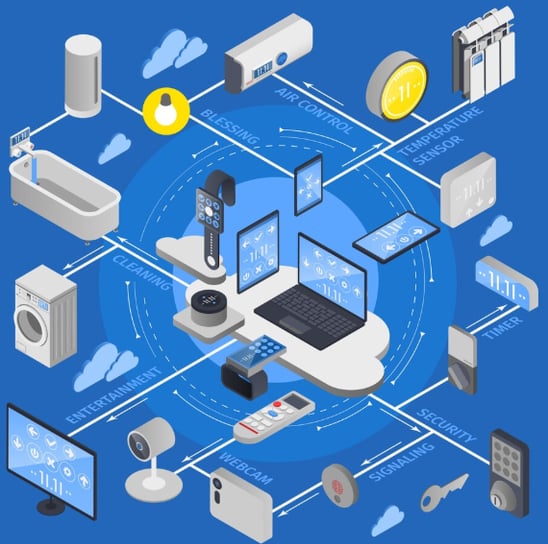
Transforming IoT Data into Actionable Insights

Advanced IoT solutions for real-time data processing and predictive analytics.

Innovative IoT Solutions for Businesses

Resiliosense IoT specializes in advanced IoT platforms and data pipelines, enhancing operational efficiency through real-time data analytics and machine learning models for predictive maintenance and environmental risk assessment.

IoT Solutions Delivered

Comprehensive IoT platform setup and advanced data modeling for enhanced operational efficiency and insights.

A computer screen displaying a data analytics dashboard with graphs and charts. A blue line graph shows fluctuations in data over time, and a section highlights the number of page views. A pie chart is partially visible, indicating a breakdown of different data elements.
Data Pipeline Setup

Deploy sensors and establish a robust data pipeline for real-time data ingestion and analysis.

Modeling & Fine-Tuning

Train advanced models and fine-tune GPT-4 for accurate root-cause analyses and risk assessments.

IoT Solutions

Innovative IoT platform for data pipeline and sensor integration.

A smartphone displays analytics data with graphs showing views, downloads, and likes. It is resting vertically on a white dock next to a small potted succulent plant. In the background, a large computer monitor is partially visible, along with a closed laptop and a white wireless earbud case.
Model Training

Developing advanced models for risk assessment and fault analysis.

A person is viewing a map with red data points on a computer monitor, likely indicating a geographical distribution. The image has a focus on technology and data analysis.
Data Analysis

Utilizing historical data for root-cause analysis and command generation.